
Jet Buxton, who helped build Orem’s pavement management system, describes a transformation rooted in both data and intuition. “Every road in Orem is inspected every three years,” he says. “We use a scoring system called OCI—Overall Condition Index—to track the health of our roads.”

But Orem’s rating system isn’t a standard off-the-shelf metric. It’s a custom hybrid model that blends the industry-standard PCI (Pavement Condition Index) with additional factors tailored to Orem’s needs. “Most cities use PCI, which doesn’t take into account ride roughness,” Buxton explains. “We’re factoring in more—like how the road feels and what we know about its history. That’s how our OCI came about.”
The system incorporates:
- Various surface distresses (cracks, potholes, surface wear, etc.)
- Ride roughness (how the road feels to drive on)
- Functional classification (e.g., collector vs. arterial)
- Historical data (e.g., past treatments and inspections)
Each road segment is scored from 0 to 100, and degradation is modeled based on road type—collectors, for example, are expected to lose about three points per year. “It gives the inspector a baseline,” Buxton says. “They can still use their judgment, but now they have objective data to guide them.”
This nuanced approach allows Orem to make smarter decisions about when and how to treat roads. “We’re not just collecting data,” Buxton says. “We’re building a system that reflects the real-world condition of our streets.”
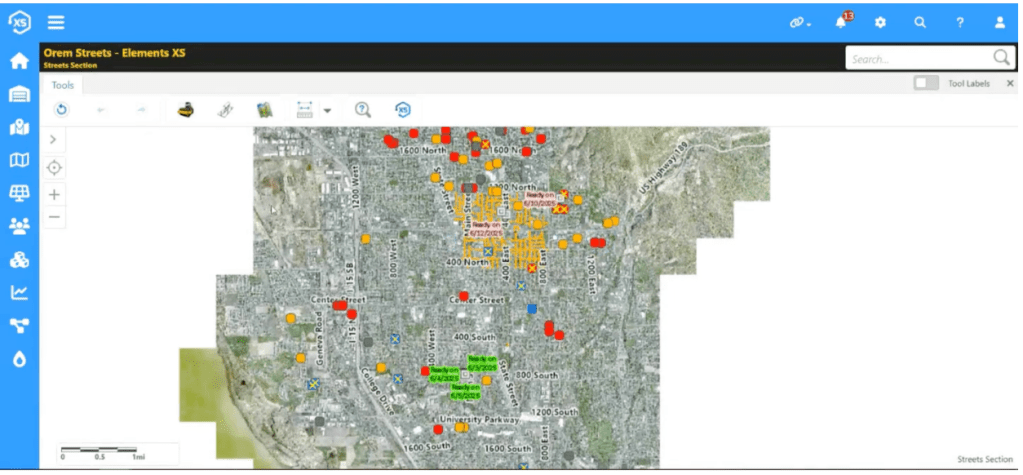
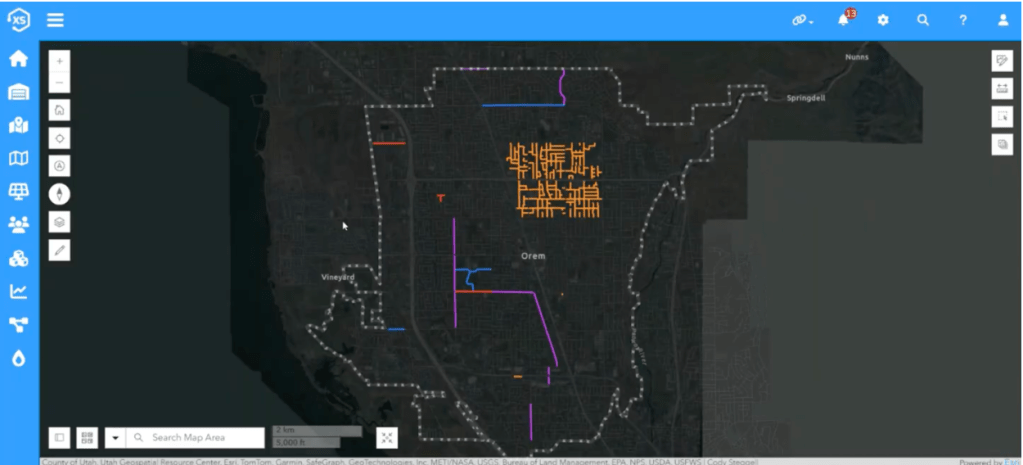
ArcGIS maps provide a visual interface for managing inspections and projects. Roads are color-coded by condition, and inspectors can click on a segment to launch a task, log findings, and update the GIS in real time. “Once the inspection is completed and the data is saved, the road segment disappears from the map because it’s no longer due for inspection,” Buxton explained. “It’s a pretty elegant system—it shows you exactly what’s due and what needs to be done next.”
The system also tracks capital improvement projects. “We do six major street projects a year,” Buxton explains. “Now we can track each one, see what percentage is complete, and report that to management.”
The integration of Elements and ArcGIS has also improved coordination between departments. “If water has a line break, they can trigger a patch request to streets,” Buxton says. “We’re using GIS to talk to each other.”
ArcGIS and Elements work seamlessly together to visualize this data on maps, color-coded by current condition or active projects. Inspectors can launch tasks directly from the map, log findings, and update the GIS in real time.